If you just ran your first AI Readiness Report and it looks like a pile of technical jargon, that’s expected. This guide shows you how to read the report, what each section means, and what to do first.
One thing upfront: the report is a diagnostic, not a grade. A poor score does not mean you are invisible to every AI system. It means there are specific, findable issues. That is more useful than not knowing.
What the Report Covers
Every audit includes these core sections:
- Performance - Can AI systems fetch your pages without timing out? This covers TTFB, CLS, and INP.
- Crawlability - Do
robots.txtrules, HTTP status responses, andnoindexsignals allow reliable access? - Content Visibility - Do crawlers see your actual content, or a JavaScript shell?
- Authority - Technical completeness signals such as schema, structure, and metadata
- Prompt Discovery - Which prompts your content appears to match
In the web app, the report becomes part of an ongoing workflow instead of a one-off snapshot. The PDF shows the core sections at a glance, while the web app splits them into tabs for deeper inspection and later comparison.
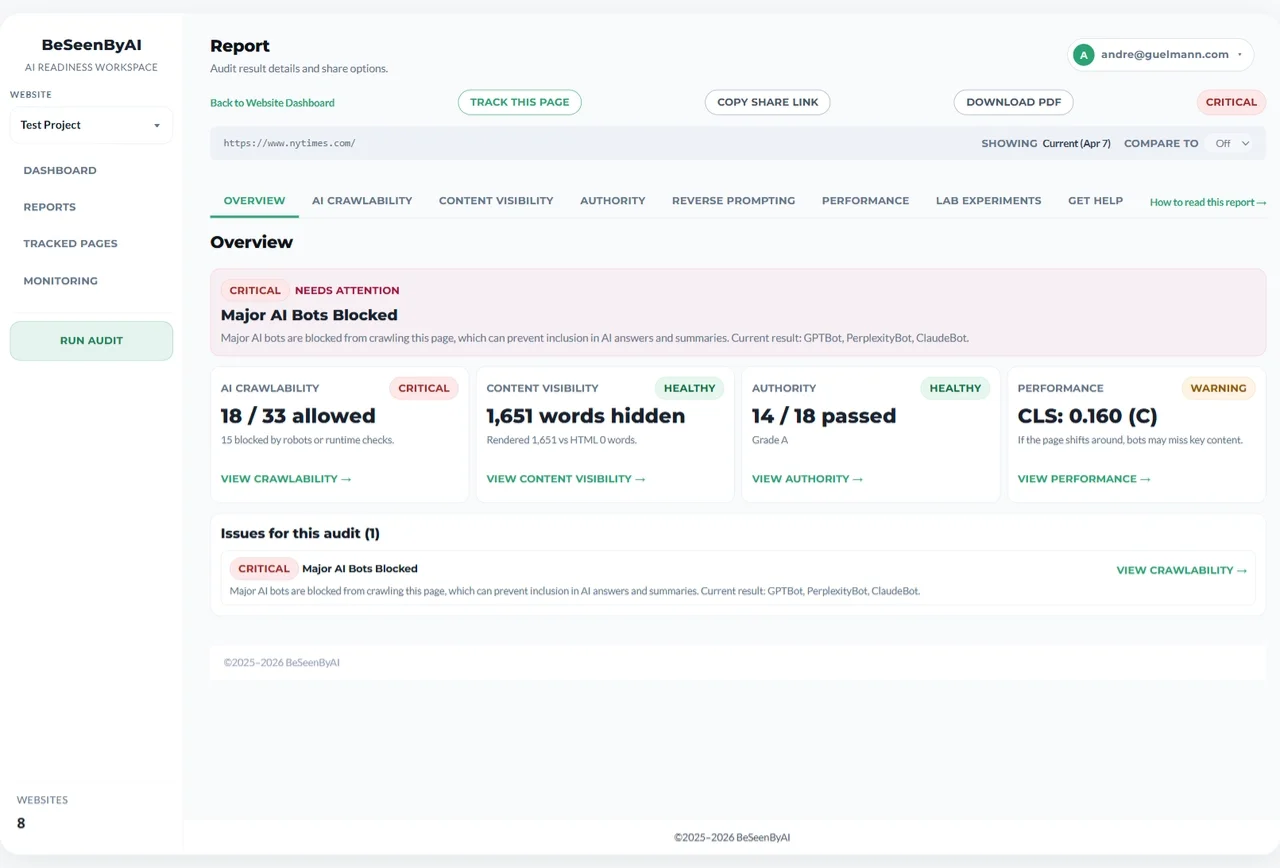 Start with the overview tab to see all diagnostic sections and their statuses at a glance.
Performance: TTFB, CLS, and INP
For Google, speed is a ranking factor. For LLMs and AI chatbots, speed is an on-off switch — you are either fast enough to be mentioned or you are invisible to them.
Performance data comes from Google’s Chrome User Experience Report (CrUX) - real visits from real users, not a lab simulation. In the web app, the Performance tab groups TTFB, CLS, and INP together so you can read them as one section.
You’ll see two numbers per metric: Page (the URL you audited) and Origin (your whole domain). A fast homepage with a slow product page means AI systems may reach some of your content reliably while timing out on others.
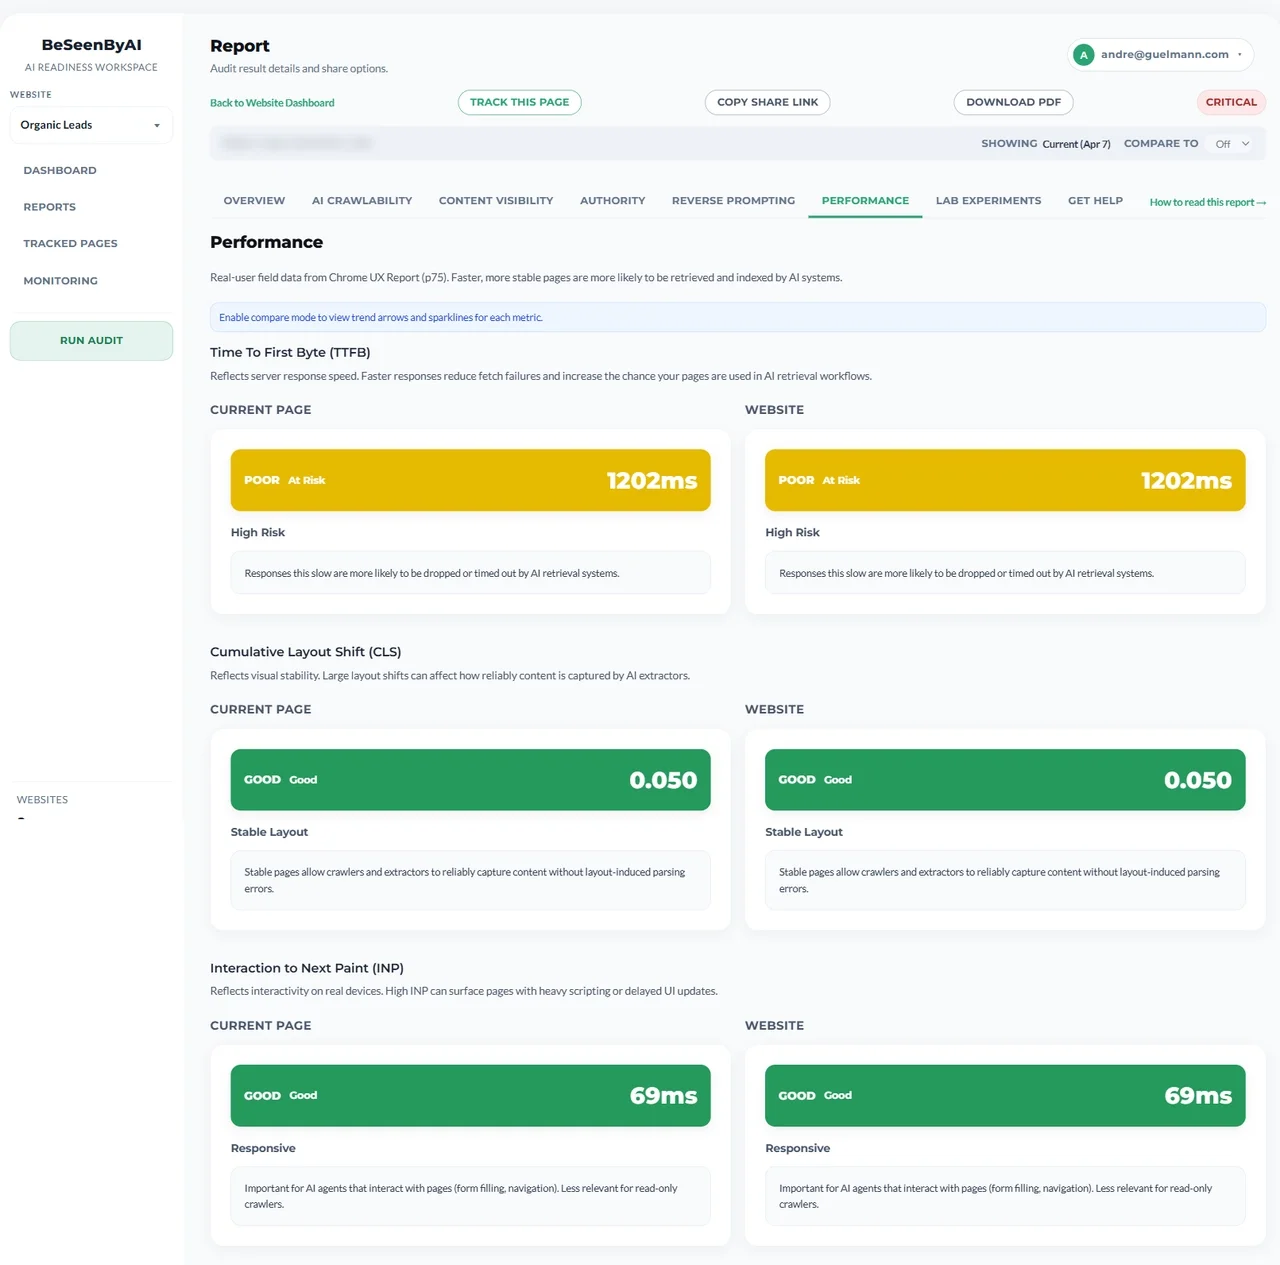 The Performance tab groups TTFB, CLS, and INP together for page-level and origin-level comparison.
TTFB - Time to First Byte
How long it takes your server to respond to a request. It’s the most important of the three metrics for AI access.
Many AI systems fetch multiple sources simultaneously under tight time limits. A slow server response - before a single byte of content arrives - can cause a timeout. Your page never gets read.
As an example: both page and origin showing 850ms (“C”) means roughly one in four users experiences even slower responses than that figure. If TTFB climbs past 1800ms, fetch failures become a real problem.
Fixes, roughly in order of effort:
- Server-side caching for pages that don’t change per request (quick win)
- CDN to reduce latency for users and crawlers querying from far away
- Database and backend query optimization (bigger lift, bigger payoff)
| Grade | TTFB |
|---|---|
| A+ | < 200 ms |
| A | 200 – 350 ms |
| B | 350 – 600 ms |
| C | 600 ms – 1 s |
| D | 1 – 2 s |
| F | > 2 s |
If you’re monitoring: Set up alerts for TTFB degradation. A jump from 600ms to 1500ms means something changed on your server — catch it before it causes widespread fetch failures.
CLS - Cumulative Layout Shift
How much your page jumps around during loading. An image that loads late and pushes content down, an ad that pops in and shifts the layout, or a font that swaps and reflows text all increase CLS.
CLS matters less than TTFB for AI access, but high scores correlate with rendering instability. Content that moves during load is harder for extraction tools to capture cleanly. High CLS also suggests late-loading elements, which often means JavaScript-dependent content — more on that in the Content Visibility section.
Fixes:
- Reserve space for images, ads, and embeds in CSS before they load
- Don’t inject content above existing elements
- Be careful with
font-display: swapif your fallback font is a different size than your web font
| Grade | CLS |
|---|---|
| A+ | < 0.05 |
| A | 0.05 – 0.10 |
| B | 0.10 – 0.15 |
| C | 0.15 – 0.25 |
| D | 0.25 – 0.40 |
| F | > 0.40 |
INP - Interaction to Next Paint
How quickly the page responds to user interactions - clicks, taps, keyboard input. High INP usually means the browser’s main thread is busy processing JavaScript.
INP is mainly a user experience signal, but poor scores are worth noting here. JavaScript-heavy pages tend to hide content from crawlers that do not fully execute scripts. If INP is poor, check whether your content visibility gap is significant too - they often go together.
Fixes if you’re in Poor territory:
- Break up long JavaScript tasks
- Defer non-critical scripts
- Move logic server-side where possible
| Grade | INP |
|---|---|
| A+ | < 100 ms |
| A | 100 – 200 ms |
| B | 200 – 300 ms |
| C | 300 – 500 ms |
| D | 500 – 750 ms |
| F | > 750 ms |
When CrUX Data Is Missing
You might see “No data available” for some or all metrics. This is not a problem with your site — it means the page does not have enough real-user traffic for Google to include it in CrUX. Low-traffic URLs hit this often.
When page-level data is missing, we fall back to origin-level data for the whole domain. When that is missing too, we say so rather than guessing. For low-traffic pages, run Lighthouse separately for synthetic performance data.
Note on monitoring: CrUX data updates monthly. Recent performance improvements may take 4–6 weeks to appear in reports. Use monitoring to track long-term trends, not day-to-day changes.
Crawlability: AI Bot Access
This section combines three crawlability layers: robots.txt policy across the 33 crawlers we check, HTTP Status Check responses from real requests, and page-level noindex directives.
robots.txt is an origin-level check — the rules apply to your entire domain, not just the page you audited. HTTP Status Check adds runtime reality: even if a bot is allowed in robots.txt, the live request can still fail because of redirects, WAF rules, rate limits, or server errors.
Here’s why this is the most binary issue in the report: if your robots.txt blocks GPTBot, nothing else matters for ChatGPT crawling. It does not matter how fast your pages are or how clean your HTML is. The crawler will not access them. The same logic applies to ClaudeBot, PerplexityBot, and others.
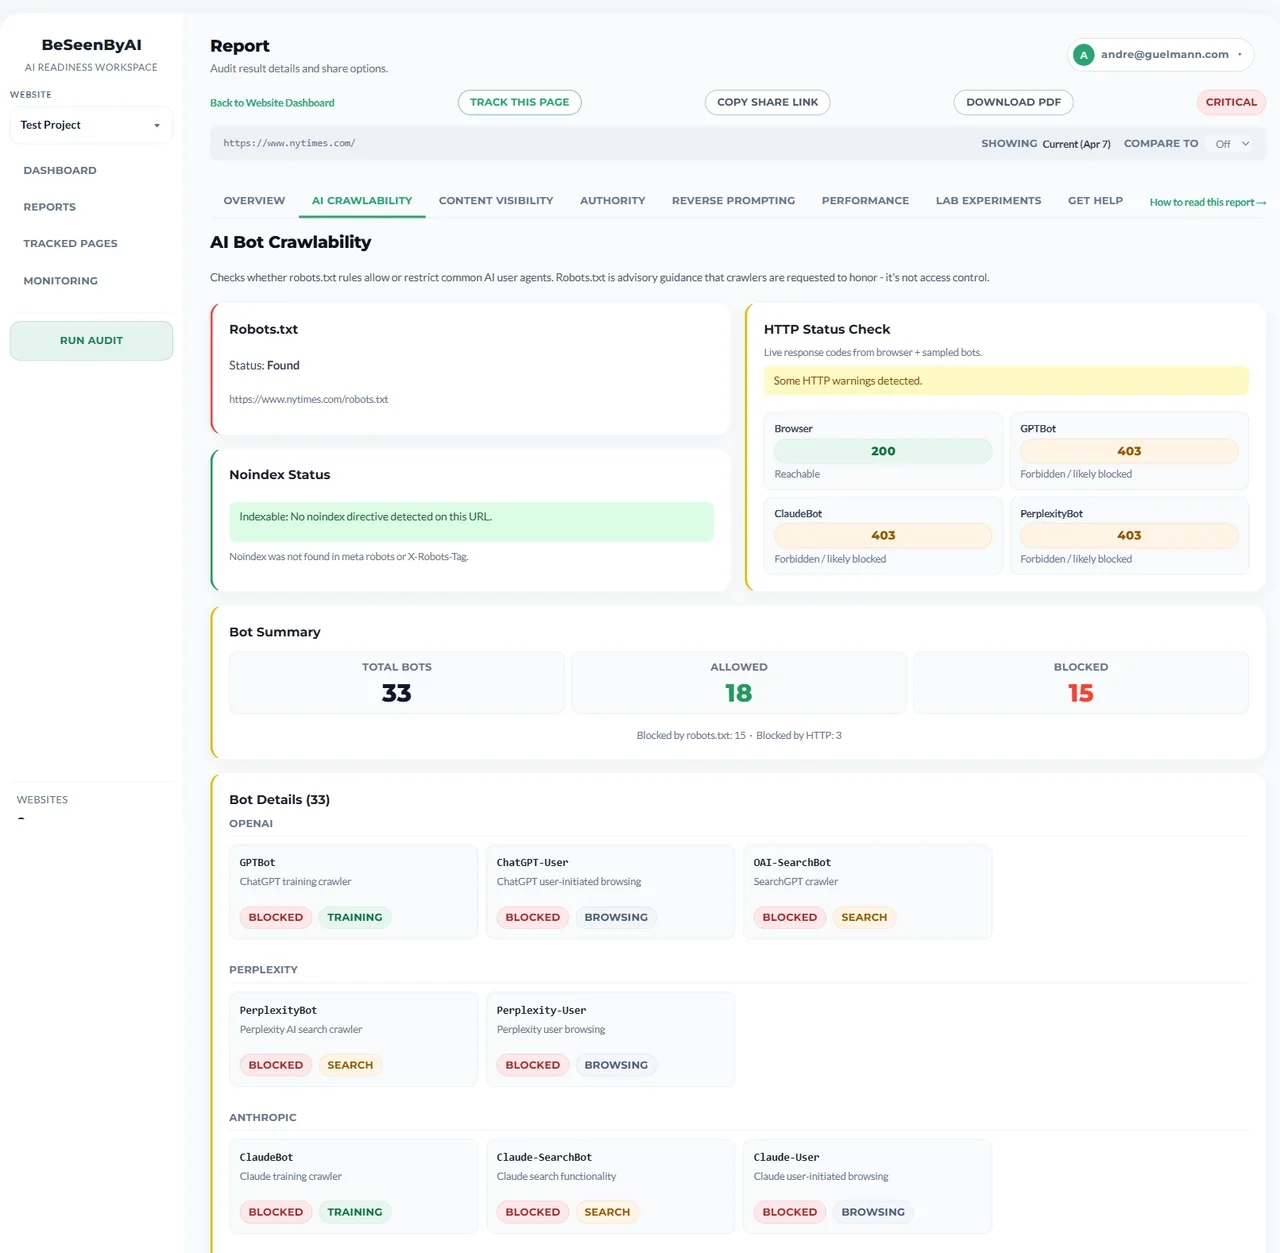 Fix
Fix robots.txt blocks first, then resolve critical HTTP status issues (429/5xx) and noindex conflicts.
Code interpretation:
2xx— reachable3xx— redirected, usually fine4xx— warning429and5xx— critical- timeout or no response — unavailable
All bots allowed: No crawlability blockers. AI systems can request your pages.
Some bots blocked: Could be intentional (you don’t want certain systems training on your content) or accidental (a wildcard rule caught more bots than you realized). Check which bots are blocked and confirm it’s deliberate.
Major bots blocked: Direct visibility problem. GPTBot, ClaudeBot, PerplexityBot, CCBot blocked means you’re likely absent from the most widely used AI systems.
The most common mistake we see: a User-agent: * followed by Disallow: / blocks everything. Developers add this to stop staging sites from being indexed, then forget to remove it when the site goes live. Check yourdomain.com/robots.txt directly to see what’s actually there.
One important caveat: robots.txt is advisory. Compliant, well-behaved crawlers — which all major AI providers are — will respect it. But it’s not a technical enforcement mechanism. If you need to actually restrict access to content, that requires server-level authentication.
If you’re monitoring: Set up alerts for robots.txt changes. Accidental blocks (like a staging config deployed to production) get caught immediately instead of weeks later.
Content Visibility: What Crawlers Actually See
We render your page twice: once with JavaScript fully executed and once as raw HTML before scripts run. The report compares those two views, shows the gap, and adds a Content Diff impact summary plus a prioritized invisible-content list.
It is important to note that a fast server response is useless if your content relies on client-side JavaScript to become visible. Most AI crawlers (like GPTBot, ClaudeBot, and PerplexityBot) are raw HTTP fetchers that do not execute JavaScript. If your website delivers a lightning-fast blank HTML shell that requires JavaScript to load the actual text, the AI will see an empty page and immediately leave. To satisfy AI platforms, your site must deliver its critical text within the initial HTML payload (via Server-Side Rendering or pre-rendering), ensuring it is instantly readable.
The bot-specific summaries for GPTBot, ClaudeBot, and PerplexityBot show what each crawler actually sees. The Render Pattern card helps explain why the mismatch exists, whether that looks like CSR, SSR, Static, or Hydrated content.
A real example from a recent audit:
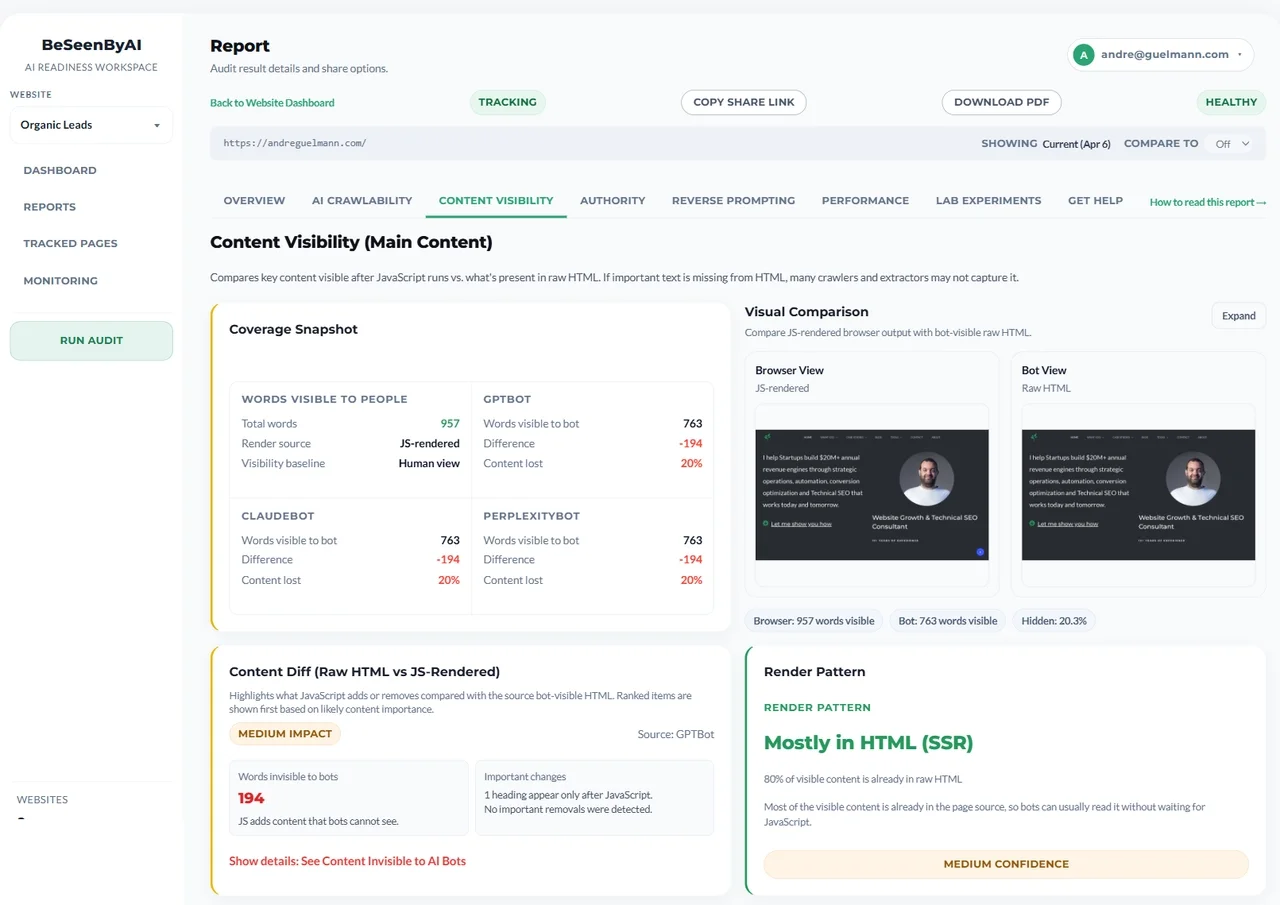 The gap percentage tells you how much content depends on JavaScript; Content Diff shows which sections matter most.
- Words visible to people: 1,018
- GPTBot sees: 813 words (−205 words, 20.1% gap)
- ClaudeBot sees: 813 words (−205 words, 20.1% gap)
- PerplexityBot sees: 813 words (−205 words, 20.1% gap)
About a fifth of the content only appears after JavaScript runs. That’s a moderate gap. The 205 missing words might be navigation elements and supplementary content, or they might be main product copy. The report tells you the size of the problem and points to the missing content that matters most.
How to read the gap percentage:
- Under 5%: Normal. Minor dynamic elements like timestamps or interactive widgets don’t meaningfully affect AI access.
- 5–30%: Worth investigating. Navigation links missing is less critical than main article text being absent. Look at what’s in the gap before deciding urgency.
- Over 30%: Priority fix. If your main content only loads after JavaScript runs, most crawlers won’t see it.
Most modern sites use JavaScript frameworks (React, Vue, Angular) to render content client-side. Users see a complete page because their browser runs the scripts. Crawlers with limited or no JavaScript execution — which describes many AI systems — see the HTML skeleton.
The fix is not to stop using JavaScript. It is to make sure critical content exists in the raw HTML response. Server-side rendering (SSR), static site generation (SSG), and pre-rendering services all solve this in different ways depending on your stack.
The same section also surfaces semantic heading order and ARIA labels from raw HTML. Those are structural extraction signals for crawlers and AI agents, not a full accessibility audit.
If you’re monitoring: Track content visibility gap changes. A template update that shifts product descriptions to client-side rendering shows up as a gap increase — catch it before it affects all your product pages.
Authority Analysis
Authority analysis looks at the technical signals that make a page look complete and trustworthy once it is accessible. It is exploratory, not a ranking predictor, and it does not measure domain authority, backlinks, or content quality.
When AI systems have multiple sources to choose from, they may favor pages with stronger technical authority signals. That is the authority hypothesis this section is testing.
The section usually shows:
- Authority score/grade — An A–F summary of technical completeness
- Page-type classification — Whether the page looks like an article, product, homepage, service page, or something else
- Grouped checks — Schema and JSON-LD validity, semantic structure, accessibility signals, and metadata quality
High authority scores usually mean the page has valid schema, clear structure, complete metadata, and enough semantic cues for AI systems to understand what kind of page it is. Low scores usually point to missing schema, broken heading order, weak metadata, or sparse structural signals.
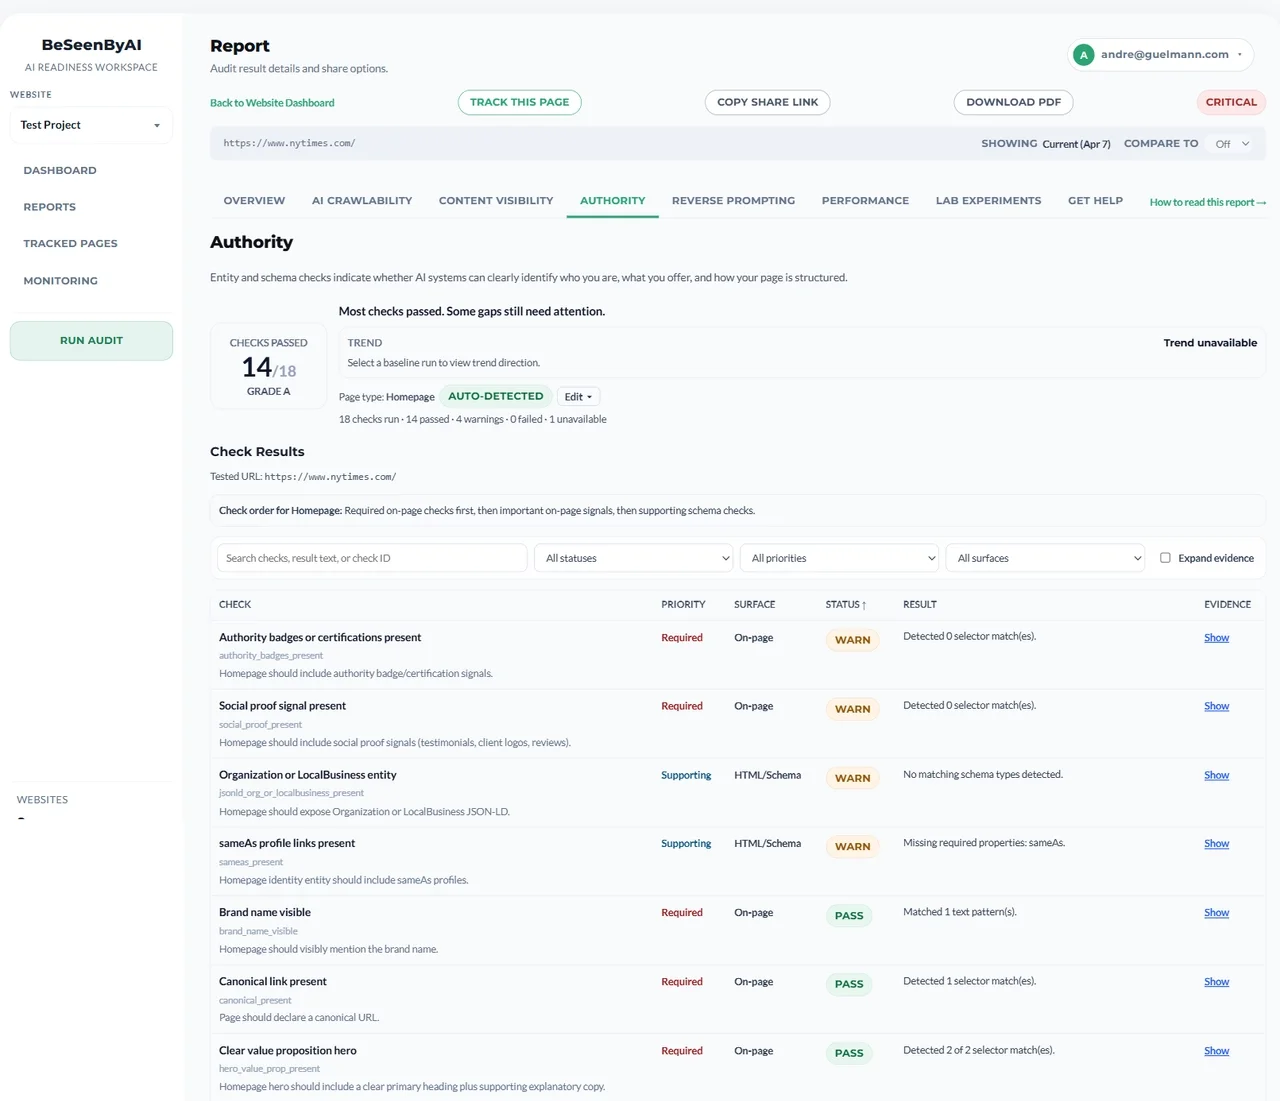 Authority analysis shows schema validity, page-type classification, and structural completeness signals.
Treat the score as directional. It helps you see where technical credibility is weak, but it does not guarantee citations.
Prompt Discovery
Prompt Discovery asks a different question: if an AI system can read this page, what prompts might it think this page answers?
It is the backward-looking version of content analysis: instead of asking what content you should create for a query, it asks what queries your existing page might already answer.
The content audit perspective is simple: understand what the page is actually good for. The optimization perspective is more tactical: check whether your target queries line up with the page. The strategic perspective is broader: find gaps where important questions do not have a strong page match.
The section shows:
- Best-fit prompts — Queries where the page content appears strongly relevant
- Unlikely prompts — Queries that sound related but do not match the page well
- Supporting evidence — The content sections, data points, or structural signals that make the match plausible
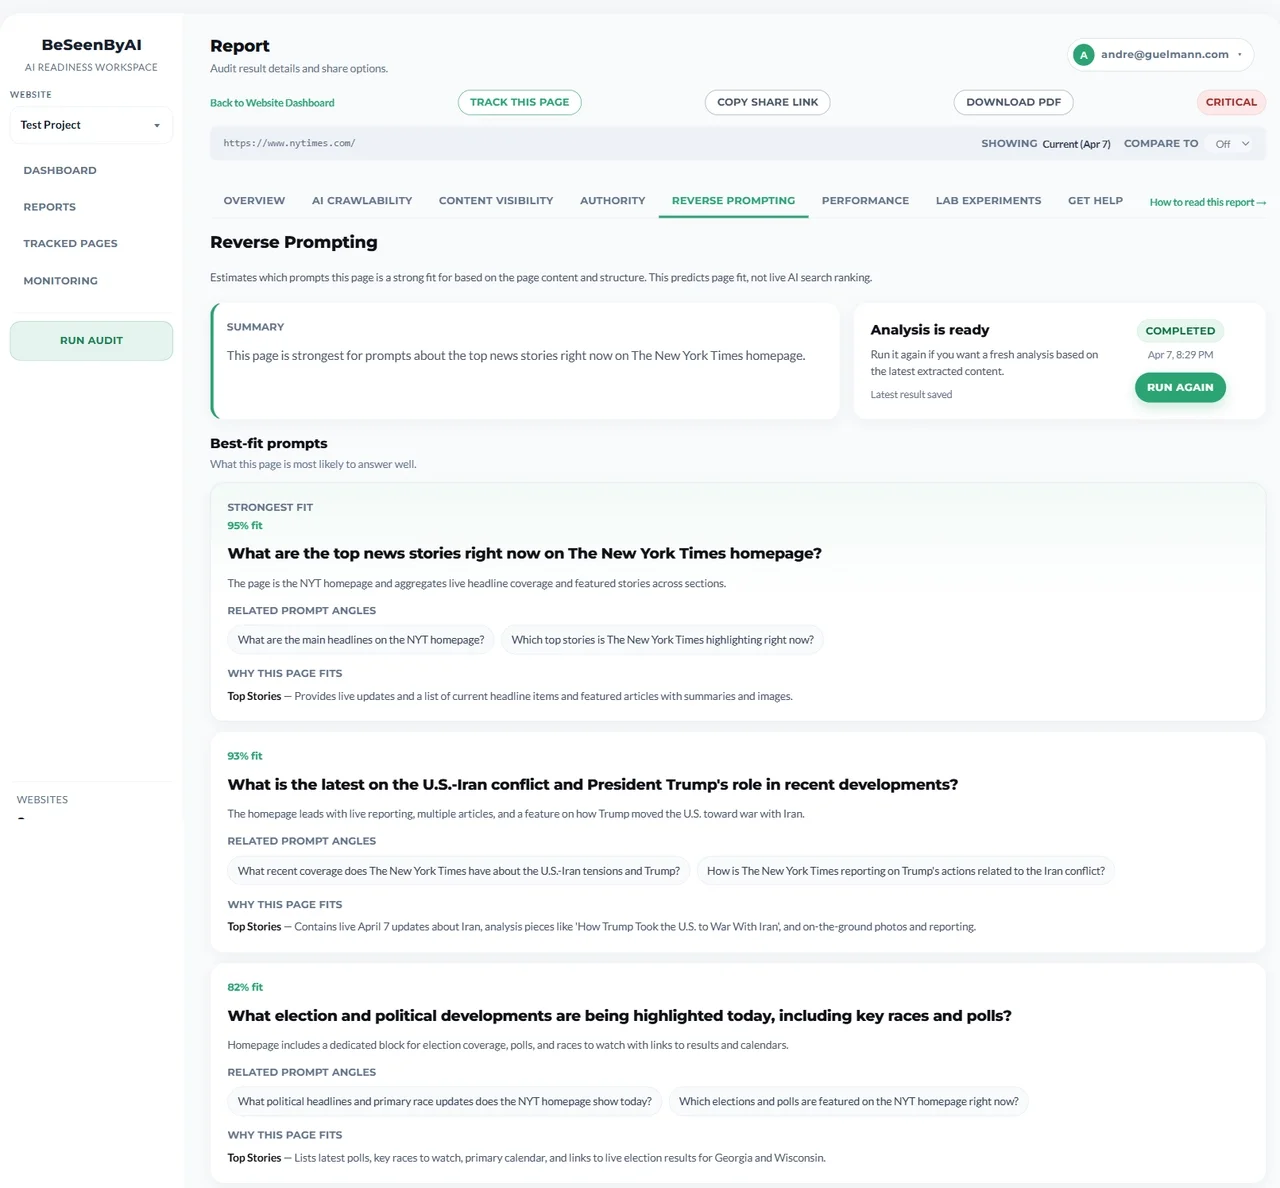 Prompt Discovery surfaces the queries your page already answers and where the supporting evidence is strong or weak.
This is useful for understanding content-query alignment and identifying gaps. It is experimental and directional, not predictive of actual retrieval or citations.
Reporting
The report is not just something you read once and throw away. In the platform, it becomes part of a reporting workflow.
- PDF export — The free output format for sharing or archiving a report
- Saved reports — Stored checks in the report history with timestamps, URLs, and page history
- Shareable links — Browser-based report delivery for teammates, clients, or stakeholders
- White-label branding — Agency-style delivery when you need the report to look like your own
The point of reporting is to make the diagnostic usable by other people, not just by the person who ran it.
Monitoring and Compare Mode
Monitoring is what turns a report from a snapshot into a record. It lets you track the same page over time, compare checks, and catch regressions after deployments or content changes.
In the report history, this is where saved reports become useful:
- Run history shows when issues first appeared
- Compare mode shows before-and-after checks side by side
- Scheduled checks catch changes without needing a manual rerun
- Alerts flag crawlability, performance, content visibility, or authority changes
Pages can be added individually or in bulk, then tracked on a schedule that fits the site. That is how one-time diagnostics turn into ongoing visibility management.
If the report shows a problem once, monitoring tells you whether that problem came back.
Lab Experiments (Exploratory)
The audit tool also includes a Lab Experiments tab. These checks cover signals that have been widely discussed — llms.txt detection and an HTML vs Markdown comparison — but none of them should be treated as core fix-first issues.
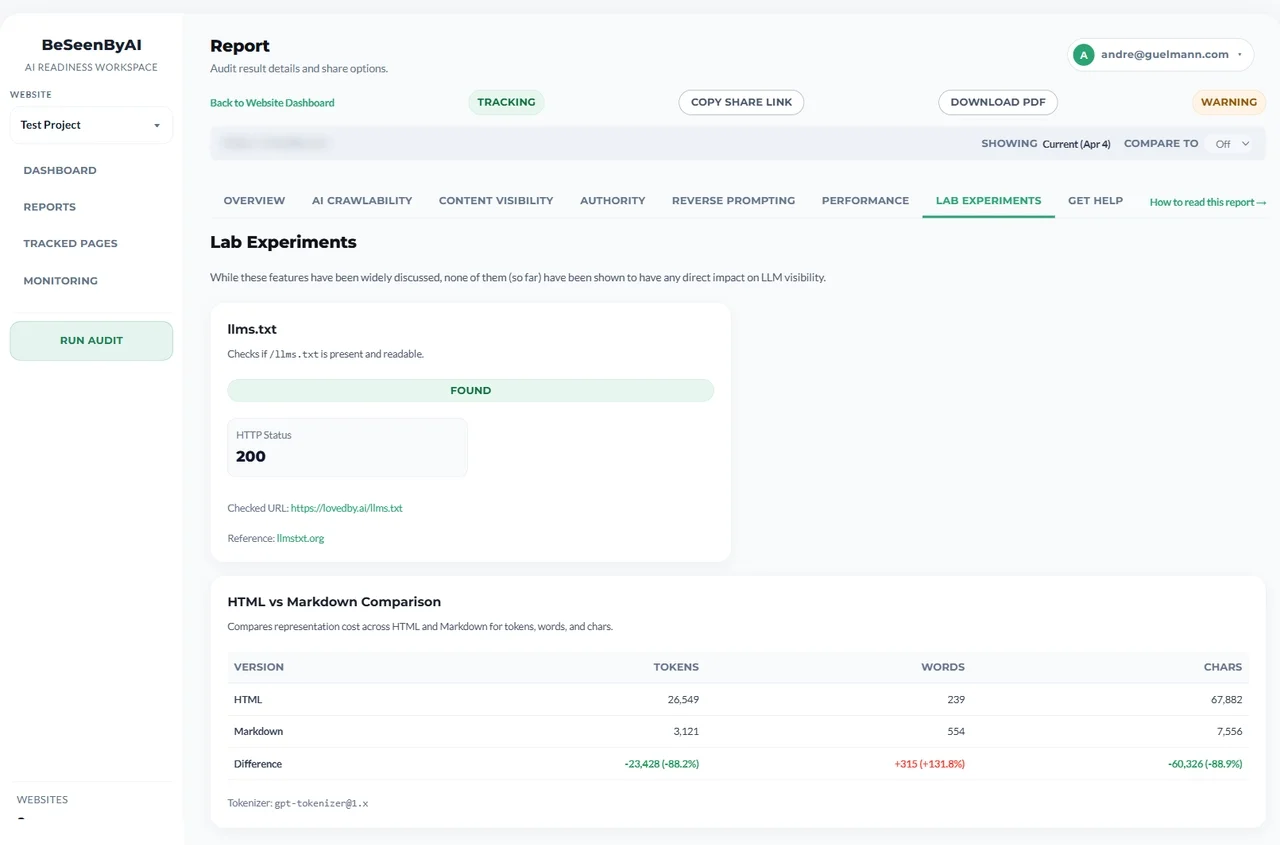 Lab experiments are hypothesis-generating diagnostics — not items that belong on a fix-first list.
Think of them as hypothesis-generating diagnostics: useful for exploring structure and readability signals, not for prioritizing the most urgent fixes.
What to Fix First
Most sites have issues in one or two core areas, not every layer at once. When there are multiple problems, this order works for most sites:
- Severe TTFB — fix first. If TTFB is over 1800ms, AI crawlers may time out before receiving a single byte of your page — before robots.txt is even checked. Server response time is the highest-leverage fix for AI access and the one that can make everything else irrelevant.
- Crawlability blockers — fix next. If major AI bots are blocked in
robots.txt, fix this before touching anything else. There’s no point optimizing a page that crawlers can’t access. - Critical content visibility gaps. If your gap is over 30% — especially if main article text, product descriptions, or key page copy are missing from raw HTML — this is the next priority. Often the hardest fix technically, but direct impact on what crawlers can extract.
- Authority issues. If the page has weak schema, broken structure, missing metadata, or poor technical completeness, fix that after the access and visibility issues are resolved.
- CLS and INP — fix last. Lower priority than the four above for AI access specifically. Address them once the bigger issues are resolved, or if you’re also optimizing for user experience and traditional search.
Reporting, monitoring, and compare mode are not fix-priority items. They are the workflow layers that help you save, compare, and share the report after the core issues are understood.
After You Make Changes
Run the audit again. Compare the new report to the old one.
The numbers should move. TTFB dropping from 1800ms to 700ms shows up clearly. A content visibility gap closing from 30% to 8% is visible in the data.
With the platform: Use compare mode to view before/after side-by-side. Export comparison PDFs for documentation. Keep the reports in history and set up monitoring to verify fixes do not regress over time.
Without platform access: Save your PDF reports and manually compare. Treat this as an ongoing check rather than a one-time test — site changes like new JavaScript frameworks, updated robots.txt, or server migrations can introduce new problems. A quarterly audit catches regressions before they compound.
If anything in your report isn’t clear, the Help page covers each metric in more detail with common troubleshooting steps.
Quick Reference
| Section | What it tells you | Classification |
|---|---|---|
| Performance | Whether fetch speed and load stability could block access | Core |
| Crawlability | Whether bots can reach the page at all | Core |
| Content Visibility | Whether AI systems see the real content or only a shell | Core |
| Authority | Whether the page looks technically complete and trustworthy | Advanced |
| Prompt Discovery | What prompts the page might plausibly answer | Advanced |
| Reporting | How to save, share, and white-label the result | Workflow |
| Monitoring | How to track changes, alerts, and history over time | Workflow |
| Lab Experiments | Exploratory signals that are not fix-first items | Exploratory |
A perfect score isn’t the goal. Knowing exactly what’s in the way — and fixing it — is.
Next Steps
Run your first audit: Check any URL →
Track changes over time: Get access →
Need help interpreting results? See detailed help docs →